“Revenue is vanity,
Profit is sanity
Cash is reality”
Slater and Gordon is a large legal firm, listed on the Australian Stock Exchange. It had been growing by acquisition since the 2010 financial year (FY10), but this came to an abrupt halt about 18 months ago. I thought it would be interesting to see if the company’s story has some lessons that might help owners of growing small and medium size businesses do it better.
If you haven’t been following the story of Stater and Gordon you can read this comprehensive summary. As things stand, its position is precarious but it is likely to survive, although only by wiping out their current shareholders and debt providers.
The Slater and Gordon story can be divided into two parts: the growth phase up to the end of the 2015 financial year (FY15) and its denouement in the 2016 financial year (FY16). This case study focuses on the first part of the story.
Over a six-year period, from FY10 to FY15, Slater and Gordon increased revenue by more than 300%, from $125 million in FY10 to $525 million in FY15; staff numbers by more than 400%, from around 1,000 to 5,350; and offices from 50 to 95.
The graphs below show the major trends arising from this growth.
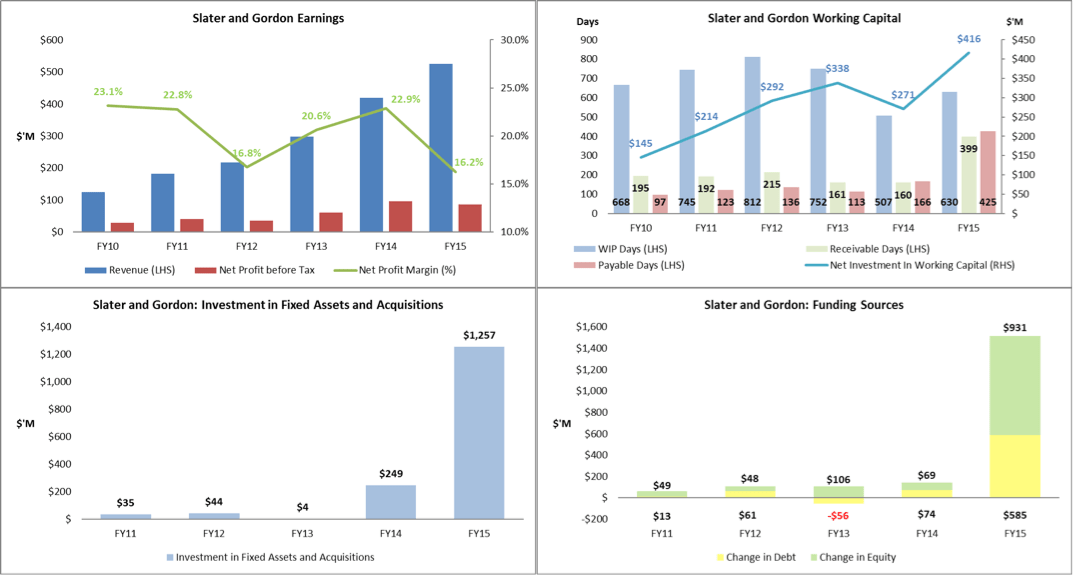
The first graph shows how tricky it can be to manage growth. Slater and Gordon’s revenue trended up but its net profit was more variable (from $29 million in FY10, to $96 million in FY14, and $85 million in FY15) and its net margin (net profit/revenue) never exceeded the 23.1% made in FY10.
Growth is also expensive. The other three charts show that Slater and Gordon’s growth required an increase to the amount of money tied up in working capital of $270 million; acquisitions of $1.6 billion; and an increase in the amount of debt by $676 million, and equity by $1.2 billion.
The value of a funds flow statement
So, if you’re an SME owner with plans to grow your business, how do you keep on top of how much cash is being chewed up, and where it is going?
One answer is to use a funds flow statement, which is constructed by comparing the balance sheet from one period against the balance sheet of a later period. It’s a great tool that helps business owners immediately grasp the drivers of the change in their cash position.
When comparing balance sheets of different periods there are some rules you need to know. They are:
- 1. The change in the balance of an account from one period to the next is akin to a flow of funds;
- 2. An increase in assets is a negative flow (a reduction in assets is a positive flow);
- 3. An increase in liabilities is a positive flow (a reduction in liabilities is a negative flow); and
- 4. An increase in equity is a positive flow (a reduction in equity is a negative flow).
Next, you need to split the balance sheet accounts into four main categories: working capital, investment, funding and earnings. A further division of the funding category, into funding by debt, equity and other sources, will help a more informed understanding of the messages from the funds flow statement.
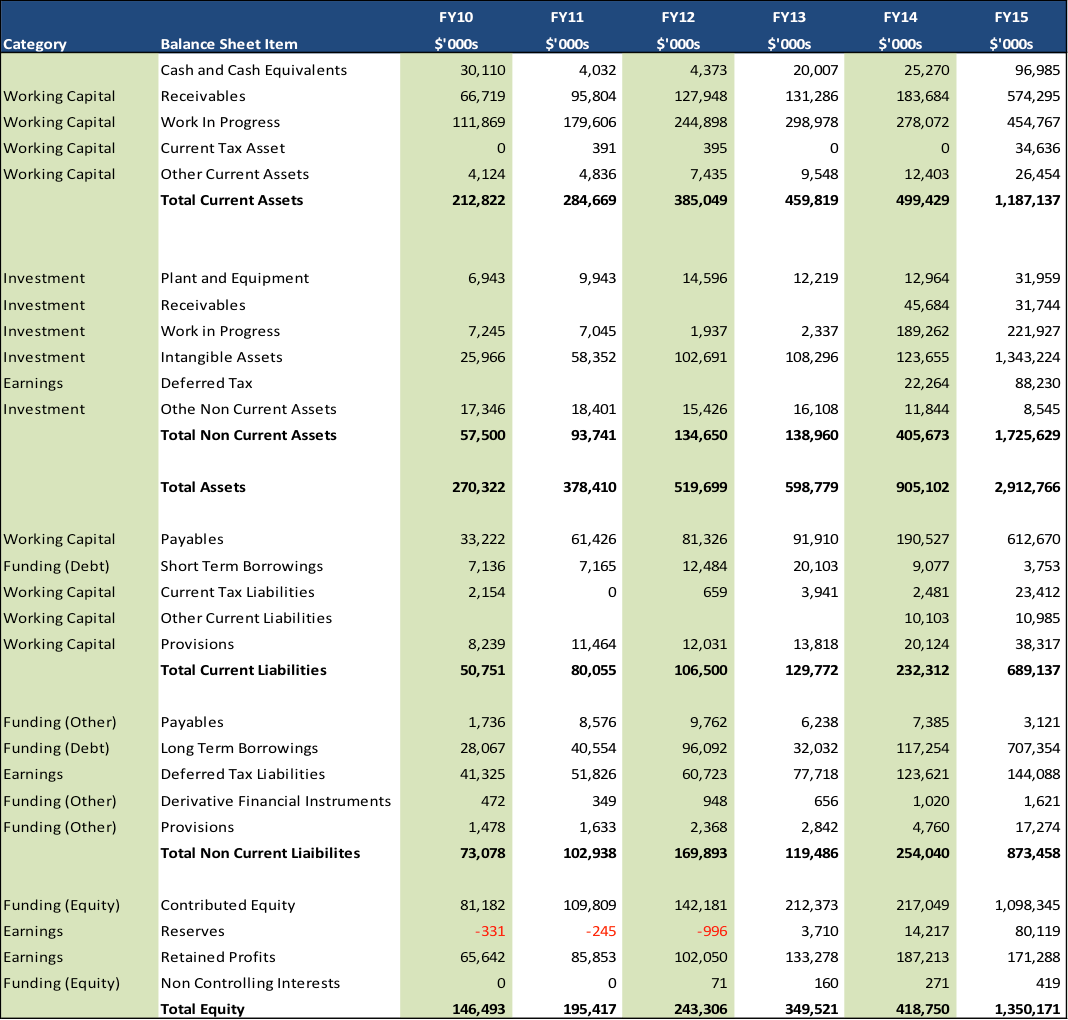
The table below sets out Slater and Gordon’s balance sheet for each financial year from 2010 to 2015. You will note I’ve set out the categories of working capital, investment, funding and earnings.
Immediately below is the funds flow statement, which has been derived by reclassifying and organising the balance sheet information using the rules outlined above.
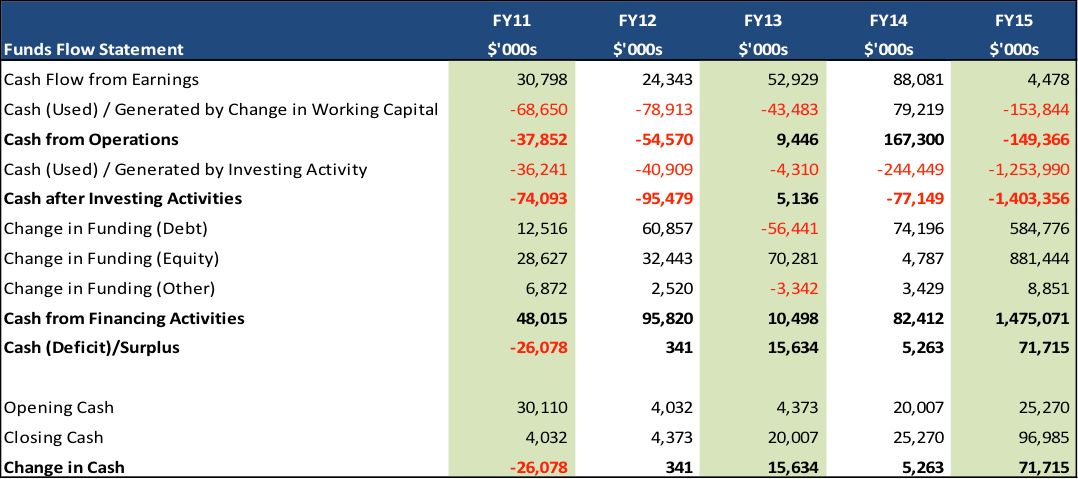
Okay, if you were the owner of this business you can now see for each period:
- 1. The amount of cash generated by the earnings of your business (cash flow from earnings);
- 2. How the working capital needs of your business add to or detract from the cash from earnings. The resultant figure is the cash from operations generated by your business;
- 3. How the investing activities of the business add to or detract from cash from operations. The resultant figure is the cash after investing activities generated by your business;
- 4. How the deficit or surplus in cash after investing activities has been funded, or used; and
- 5. The net increase or decrease to cash and cash equivalents.
The waterfall graph below aggregates the information from the funds flow statement to show how the movement in cash over that period is derived:
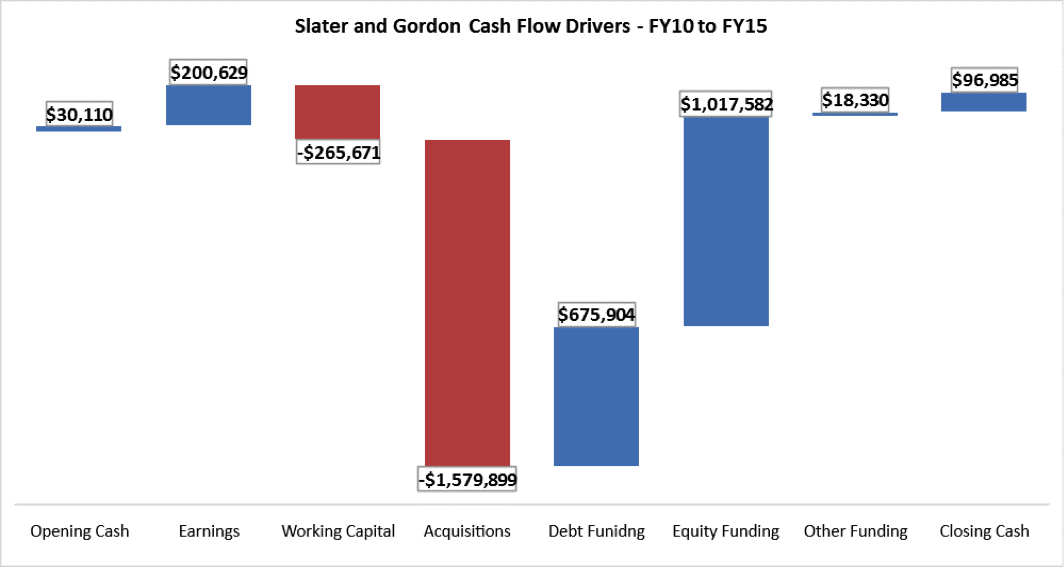
You can see:
Slater and Gordon’s earnings contributed $201 million to the overall cashflow of the business.
But, the change in working capital used $266 million of cash.
This means the operating cashflow of the business was negative, to the tune of $65 million.
The business spent $1.58 billion dollars on acquisitions.
It had a total funding need of $1.645 billion dollars, which it met by raising additional equity of just over $1 billion, additional debt of $675 million and other funding of $18 million.
The conclusion from this analysis is that the surplus of funding raised over the funding need has driven the $67 million increase in cash and cash equivalents.
Lessons for SMEs
What then are the lessons for owners of growing small and medium size businesses from the Slater and Gordon story?
- 1. Growth is expensive;
- 2. The “cost” of growth isn’t just the cost to acquire another business or more resources. It’s also the money required to be invested in the additional working capital needs of the business;
- 3. Growth is tricky to manage and requires constant vigilance from the business owner. Pay attention to your balance sheet, not just your profit and loss statement;
- 4. To use your balance sheet usefully, you need to compare the current period against an earlier period;
- 5. Measure and manage your working capital. Focus on turning work in progress into debtors, and chase your debtors to ensure they pay on time and respect your agreed terms with your creditors. It is not an accident that the only year Slater and Gordon produced a strong surplus in its cash from operations (FY14) coincided with a reduction in the amount of money tied up in working capital;
- 6. A positive cash from operations matters. It is the only way you can repay debt without selling off parts of your business or raising new equity; and
- 7. Simply looking at the balance in your bank account is pointless — it does not tell you how the balance was derived. In Slater and Gordon’s case, the increase in its cash position was due to funding activities that exceeded their actual needs. It was not because of an improvement in how the business was operating, manifesting as higher profitability, or better management of working capital.
One final lesson — make sure your accounts are up to date and properly recorded. Review them regularly — every month at a minimum. They are a source of valuable information that will help you make good decisions.
Never miss a story: sign up to SmartCompany’s free daily newsletter and find our best stories on Twitter, Facebook, LinkedIn and Instagram.


